Features Walkthrough
This guide takes you through the main features of GradientHarbor, from asking your first question to building a dashboard.
Chat — Ask Questions About Your Data
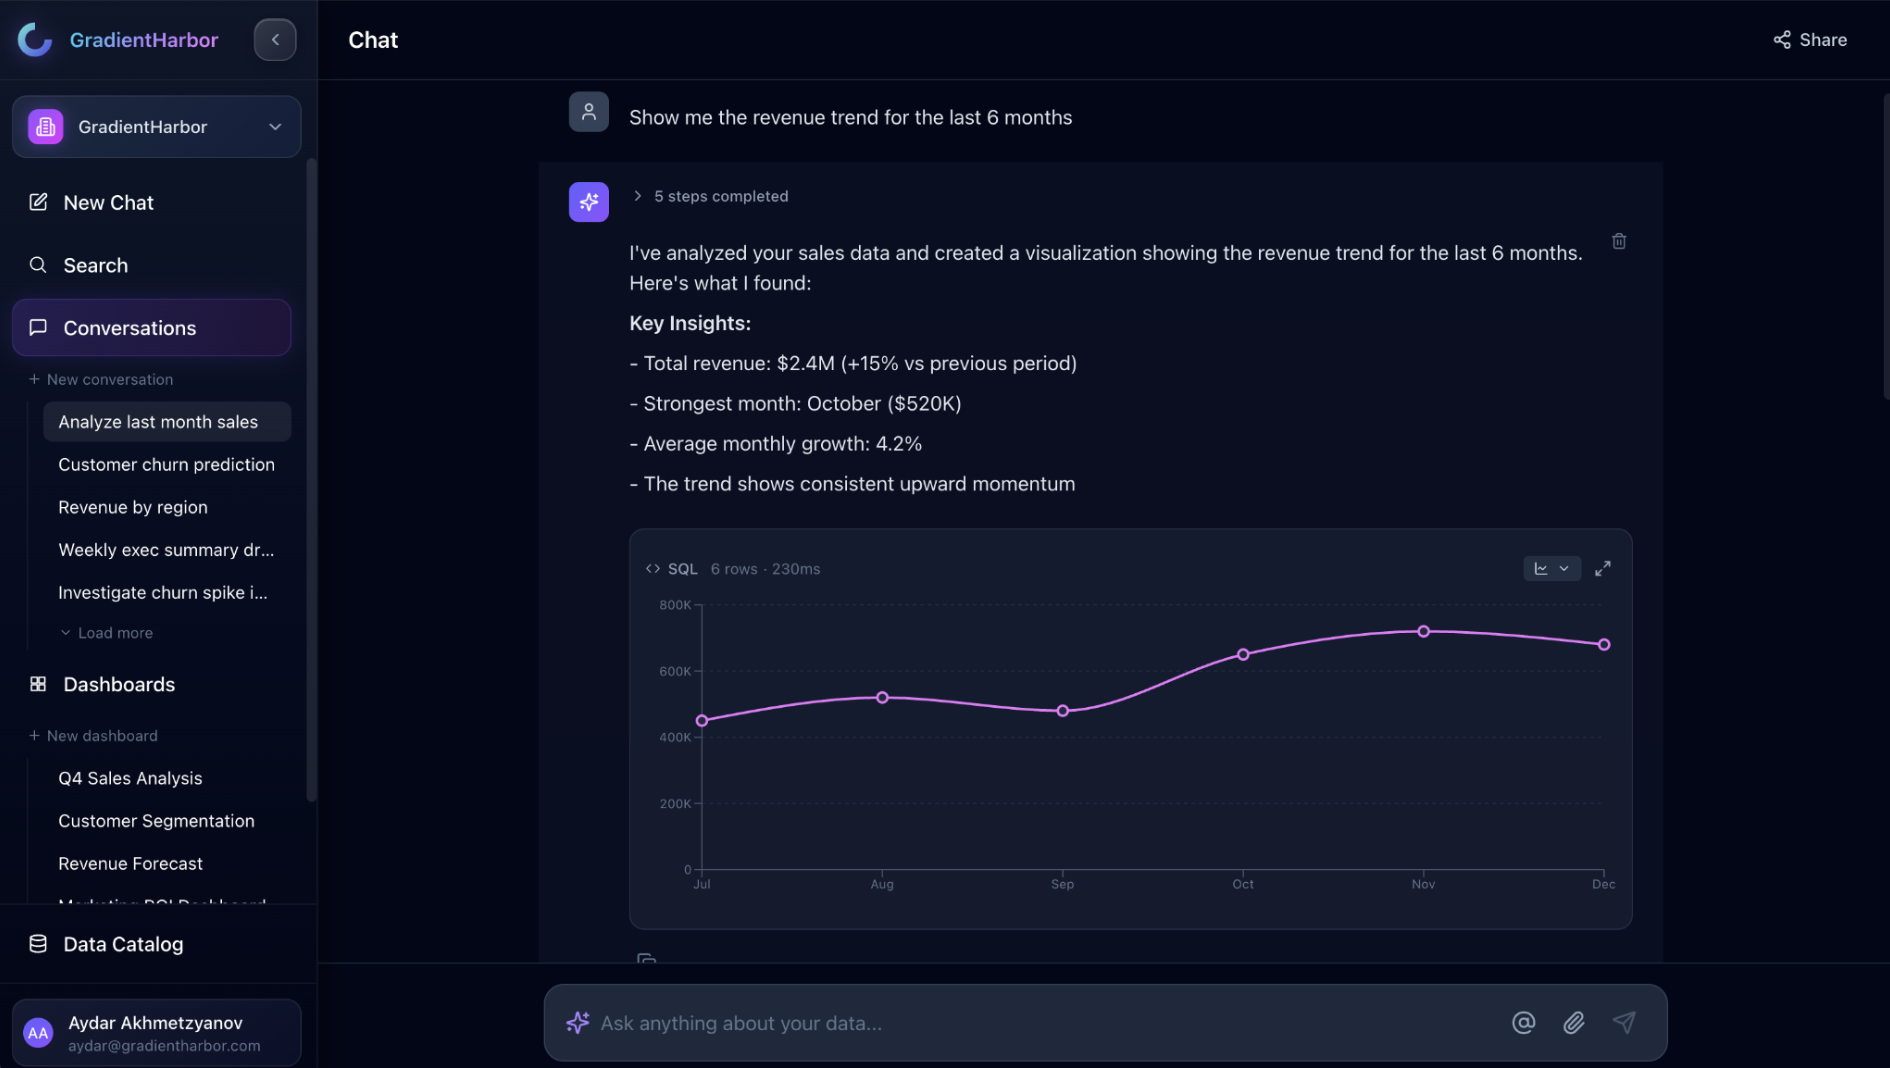
The chat interface is the primary way to interact with GradientHarbor. It's available from the sidebar under New Chat.
Asking a Question
Type a natural language question, and the AI agent will:
- Search your data catalog for relevant tables
- Write a SQL query
- Execute it against your connected database
- Return results as a table or chart
Example questions:
- "What were our top 10 customers by revenue last month?"
- "Show me daily active users over the past 90 days as a line chart"
- "Compare order volumes between Q1 and Q2"
Attachments
You can attach files to your chat messages:
- Images — Sent as visual context (e.g., screenshots of reports you want to replicate)
- CSV files — Automatically summarized with schema and sample rows, queryable via DuckDB
- PDFs — Text extracted automatically and available as context
Drag and drop files onto the chat input, or click the attachment button.
Chat Sharing
Each conversation can be set to:
- Private — Only you can see it
- Organization link — Anyone in your org with the link can view it
Dashboards
Browsing Dashboards
The Dashboards section in the sidebar shows:
- Folders — Organize dashboards into nested folders
- Recent dashboards — Quick access to recently viewed dashboards
Creating a Dashboard
- Click New Dashboard from the dashboards page
- Give it a name
- You'll enter the dashboard editor
The Dashboard Editor
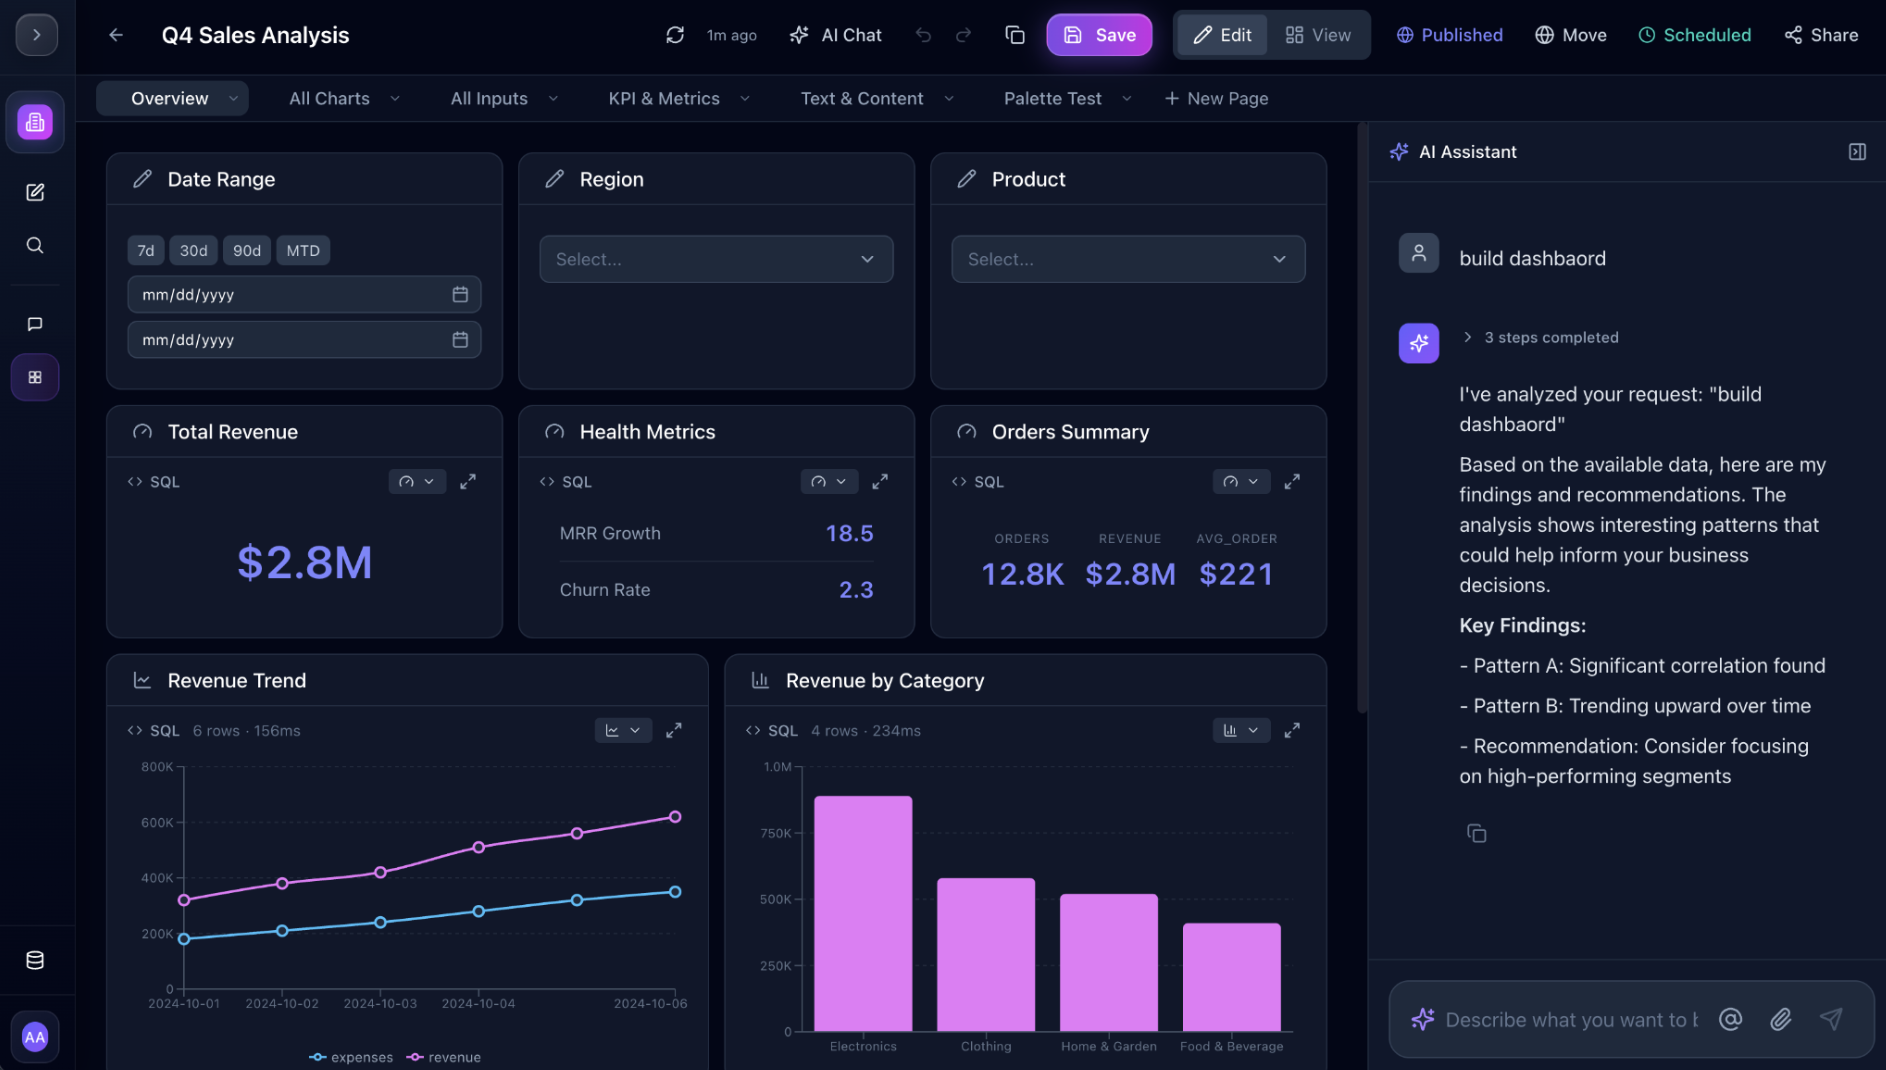
The editor provides a grid-based layout where you add cells:
- Table cells — Display query results in sortable tables
- Chart cells — Visualize data with bar, line, area, pie, radar, scatter, or treemap charts
- KPI cells — Show key metrics as large numbers
- Filter cells — Add interactive inputs that parameterize other cells' queries
- Text cells — Add headers, descriptions, or annotations
You can also use the AI agent to create cells — describe what you want in the chat sidebar, and the agent will generate the appropriate cell with its query.
Multi-Page Dashboards
Dashboards support multiple pages. Each page has its own layout and cells. Use pages to organize related views — for example, an "Overview" page and a "Details" page.
Data Catalog
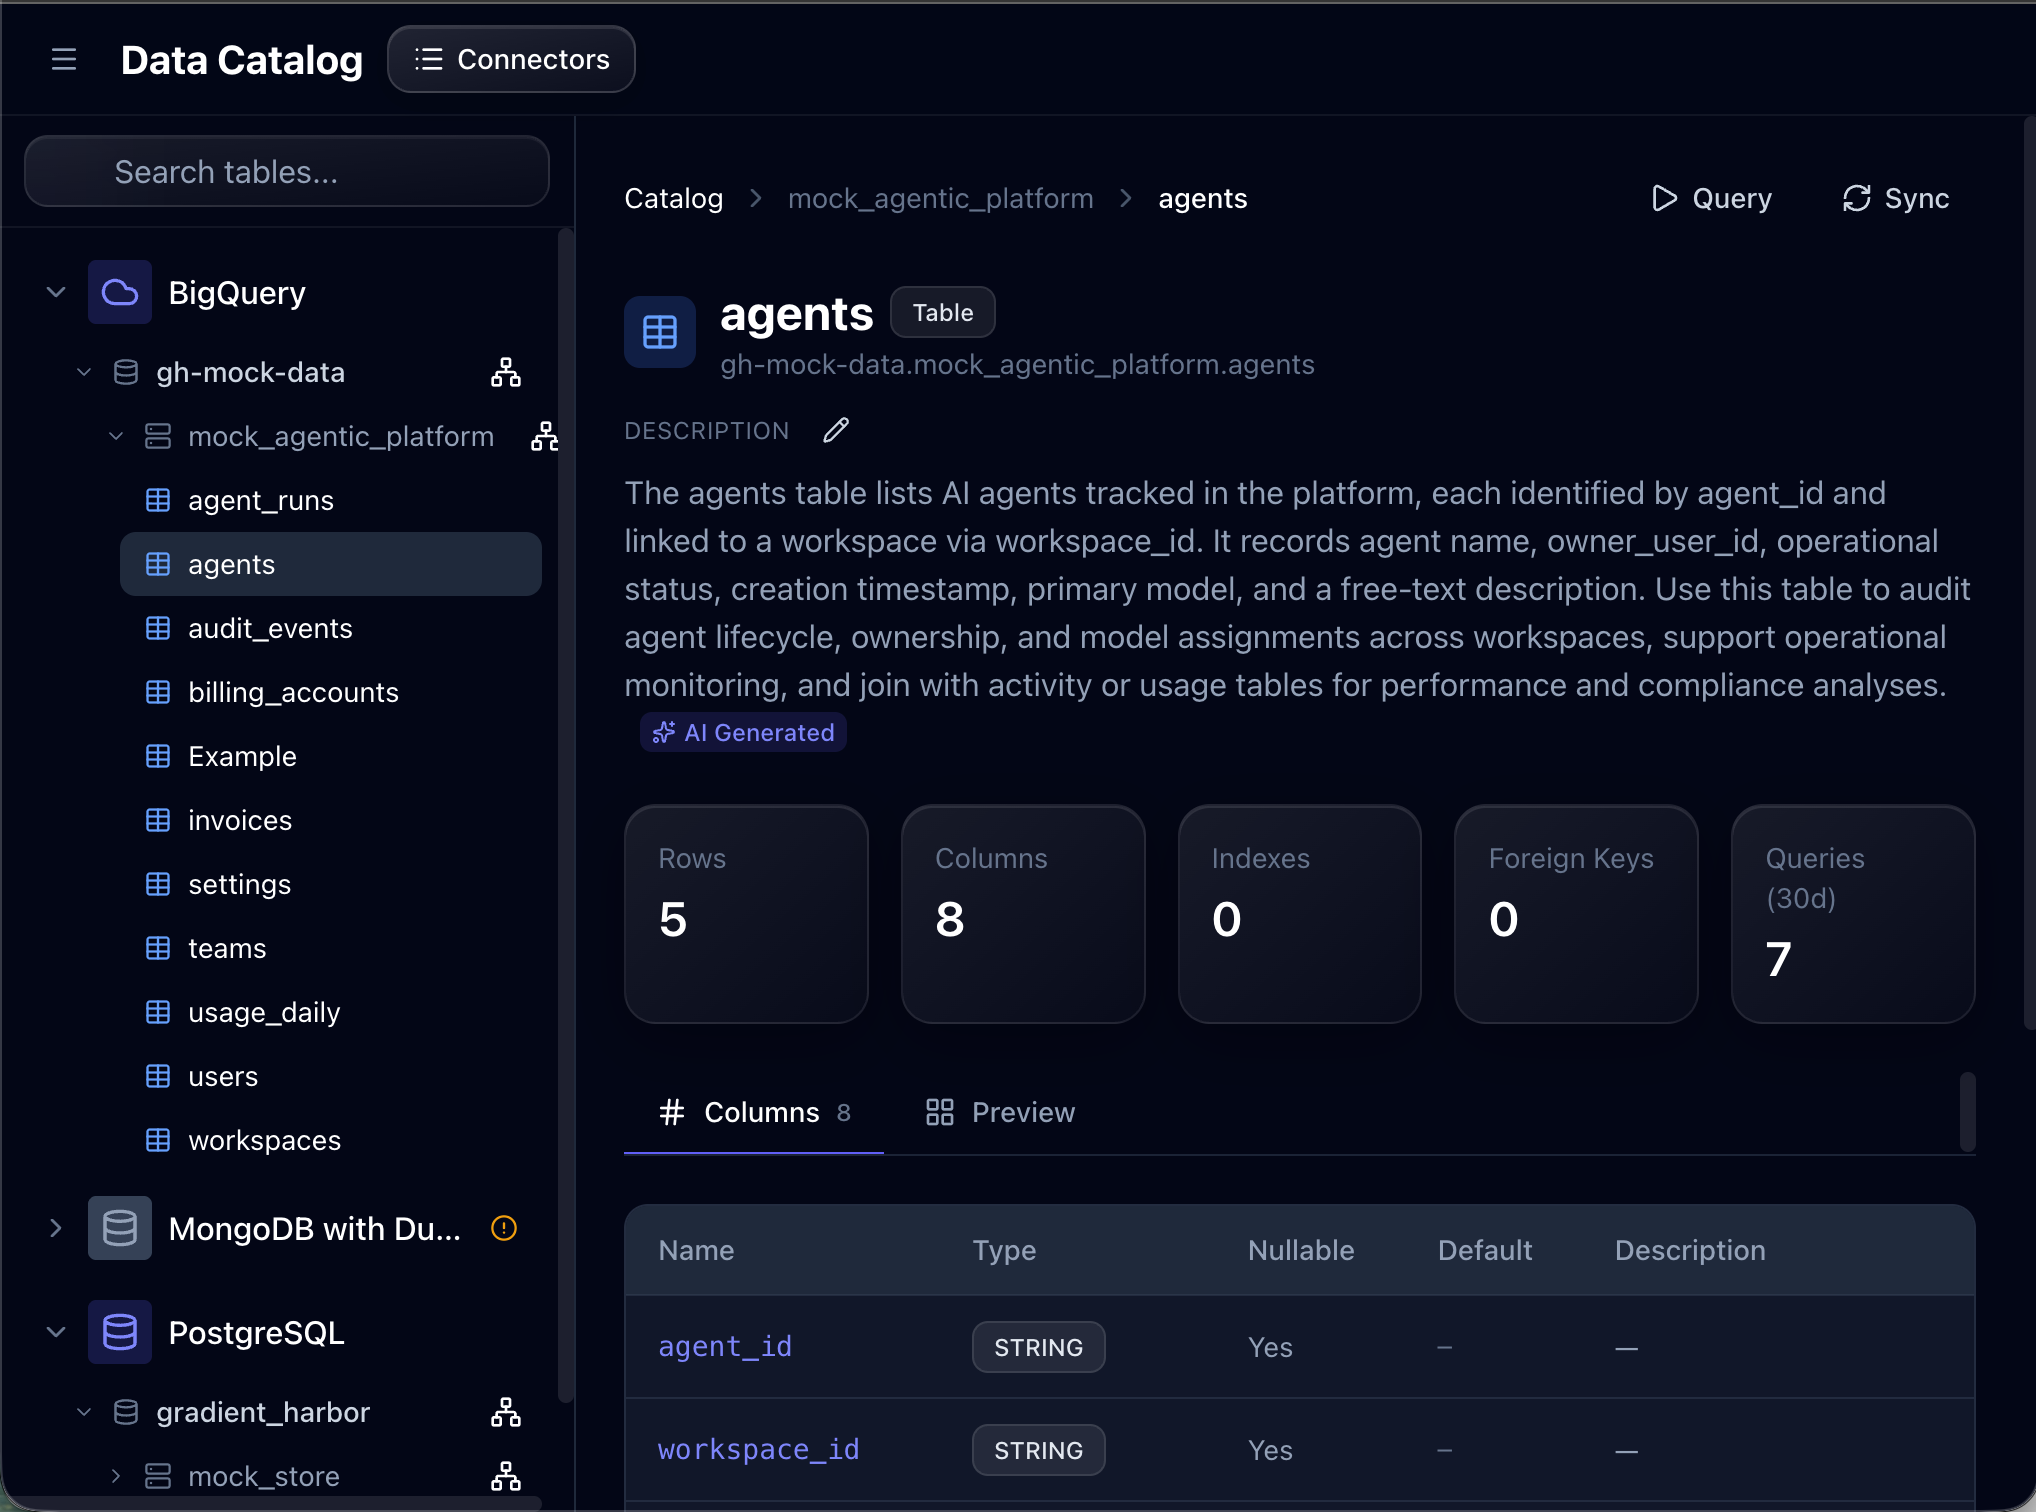
The Data Catalog provides a searchable inventory of all tables and views across your connected databases.
For each table, you can see:
- Column names, types, and descriptions
- Indexes and foreign keys
- Sample data
- Query popularity (how often the table is used)
Entity Relationship Diagram (ERD)
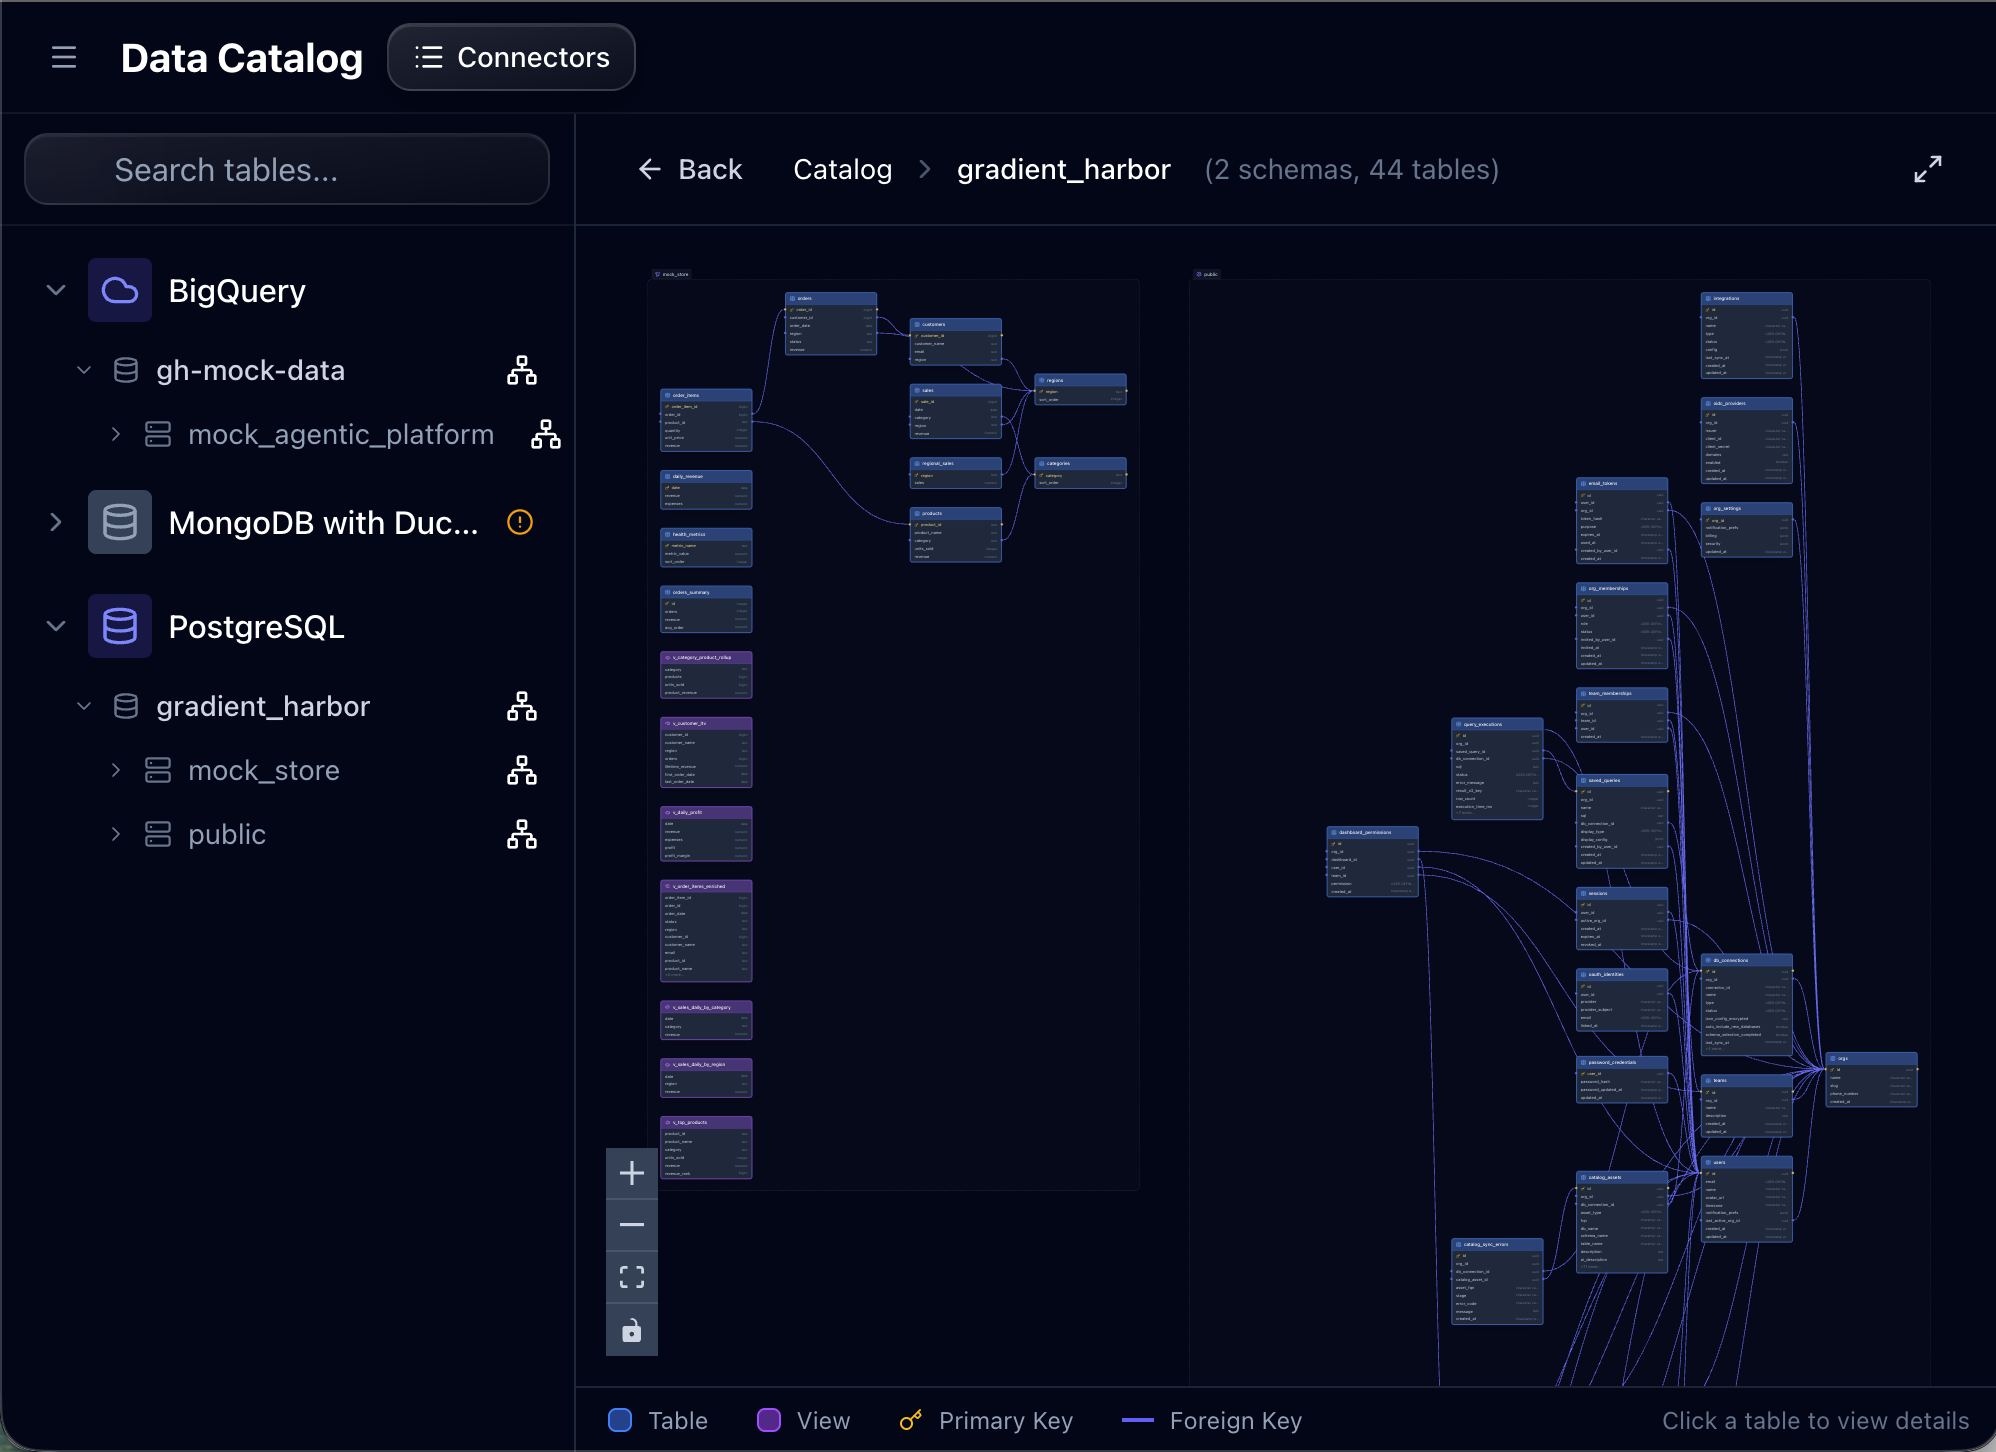
The ERD view visualizes foreign key relationships between tables, helping you understand your data model at a glance.
Saved Queries
The Queries section lets you write, save, and manage SQL queries:
- Full SQL editor with syntax highlighting
- Select which database connector to run against
- View results inline with export to CSV
- Save queries for reuse and sharing
Search
The Search page provides semantic search across your entire workspace:
- Dashboards
- Tables from the catalog
- Saved queries
Results are ranked by relevance and can be filtered by type.
Next Steps
- Connect a Database — Set up your first data connector
- Building Dashboards — Deep dive into dashboard creation
- AI Agent Architecture — Learn how the agent works under the hood